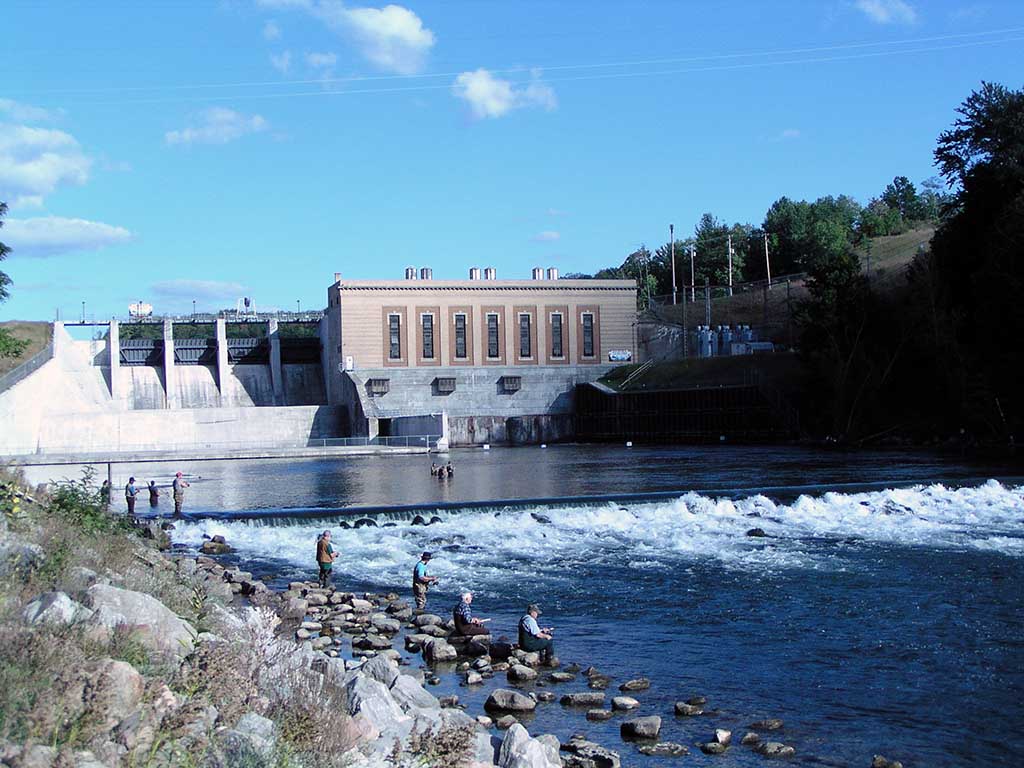
We are extremely pleased to announce that MediaLab was an integral part of the data processing behind an exciting research project on Little Brown Bats (Myotis lucifugus) at Tippy Dam in Michigan!

See the article here from PLOS!
See the blog post from one of the researchers!
Why is this research important?
A fungus known as White Nose Syndrome (Pseudogymnoascus destructans) has been decimating bat populations all over the world, but this particular bat population is surviving in spite of it being present in their hibernaculum.

A large part of the research consisted of analyzing 1000s of hours of infrared video of the bats in two different “rooms” of the dam’s interior. The researchers originally tried to use an existing “recipe” to process the videos, but encountered many technological obstacles carrying it out, and ultimately met with failure.
Out of this failure, MediaLab was born! Using Microsoft Visual Studio, the OpenCV computer vision library, and the Universal Windows Platform (UWP), we set about creating the image processing application that brought this research project to a successful dataset for analysis. We are also pleased that it is in Windows Store for the last 18 months, with hundreds of installs!
Why didn’t we mention this sooner?
Due to the competitive nature of research in this field, we were asked to keep a “low profile” with regard to bragging. Nevertheless, many of our screen images posted in the Wiki and elsewhere provided clues to how MediaLab was being used to produce hundreds of megabytes of data to bring this research project to a successful completion.
What did we do with MediaLab on this project?
There were several key processing elements:
- Load seven-day-long video files and extract “frames” every 10 minutes.
- Save each frame as an individual image file for subsequent processing.
- Then for each “set” of frames:
- Run a MediaLab “pipeline” consisting of multiple CV operations.
- Contrast-limited Adaptive Histogram Equalization
- Gaussian blur
- Threshold
- Contour extraction (canny)
- Contour data output
- Different videos required parameter adjustments on the pipelines.
- Output the data into CSV file(s) for subsequent processing.
- Run a MediaLab “pipeline” consisting of multiple CV operations.
- Then for each “set” of CSV data files:
- Process in the R statistics platform to produce statistics and graphs.
